

20 Sep 2021
A new book co-authored by Dr Peng Zhao of Xi’an Jiaotong-Liverpool University’s School of Science brings his teaching about statistics full-circle. The book, Modern Statistical Graphics, draws in part from his past classroom teaching experiences. Now, it will benefit his current and future classes as a valuable resource.
Amateurs, beginners and experts alike can use the book to learn more about the R statistical programming language and environment. Although the book is written in Chinese, studying the graphics in the book can benefit students who do not speak Chinese, Dr Zhao says. Each graphic includes a link that allows students to obtain the R code that produced the graphic.
“Students can directly refer to the code from beginning and end to learn the skills,” he says.
Using the R-created graphics helps students grasp concepts in statistics more easily, Dr Zhao says.
"During each statistics class, I use graphics to explain theories, models and applications of statistics. With the graphics, students more easily understand what I am trying to teach compared to if they just read a definition or a formula.”
“The book should serve as a useful reference book for students. It combines both theoretical and practical studies, and it’s fun to read”.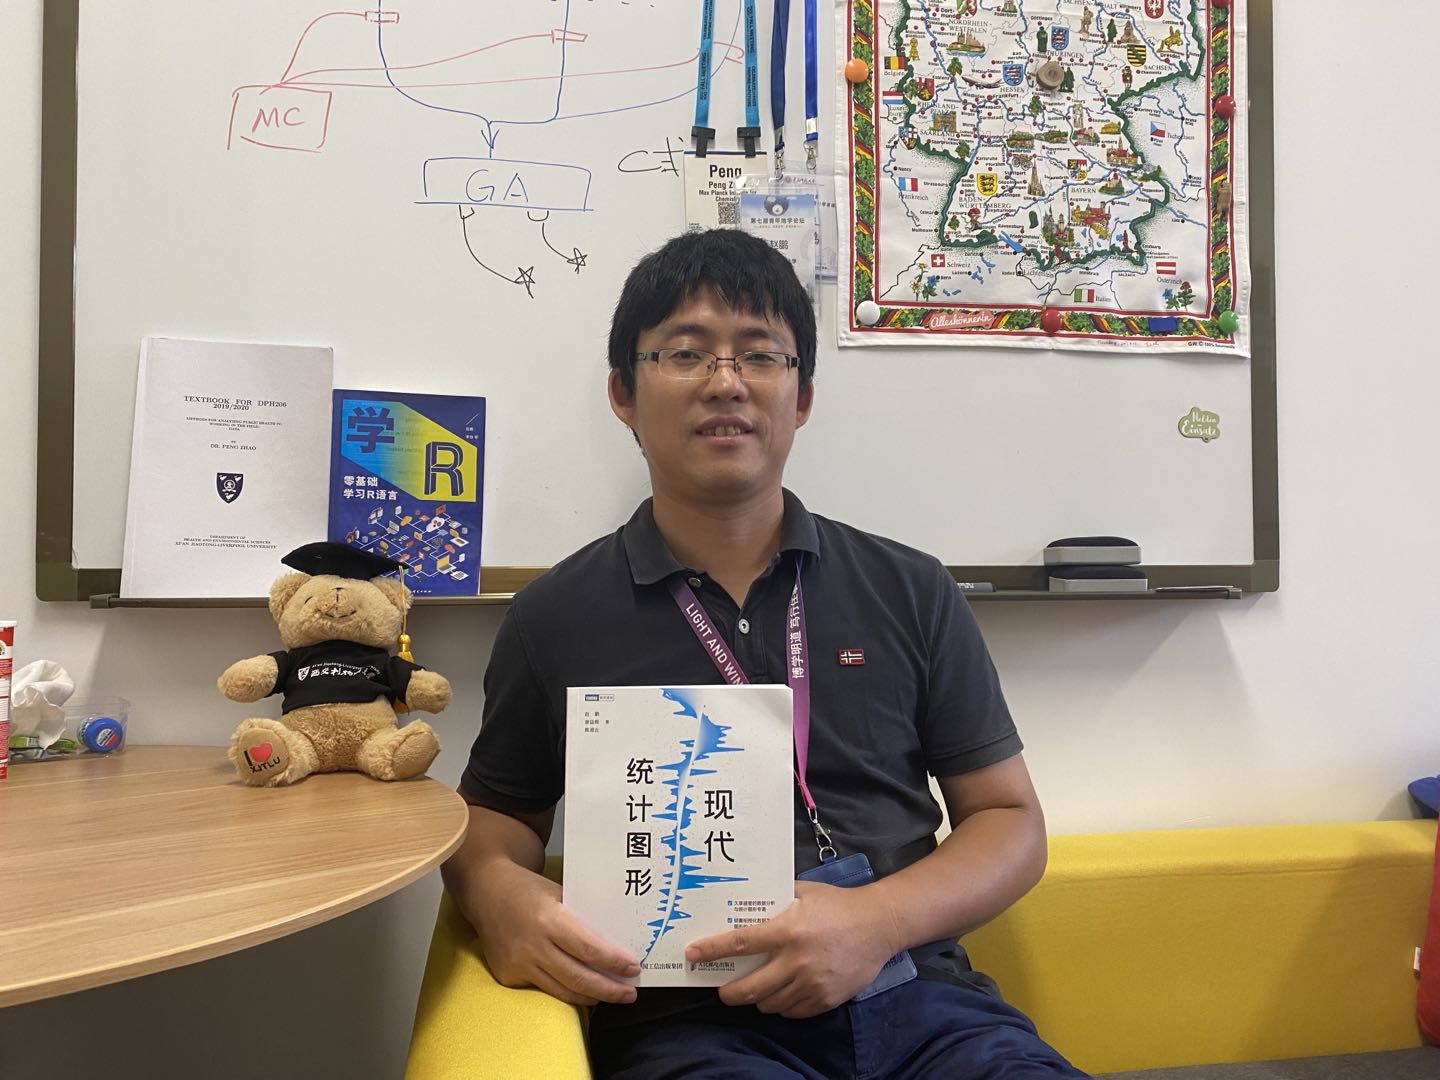
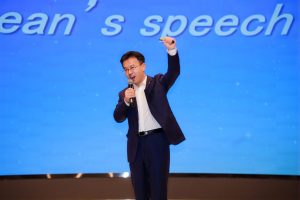
(Dr Peng Zhao announces his new book)
To draw readers’ curiosity, this book is based on real life, such as the sharp increase in retail pork prices and the pay gap between male and female television actors. Using the R language to create graphics from actual data provides insights that are hard to see otherwise, he says.
“The role of creating the graphics is to better show us what happened, and then explore what led to it without getting lost in complex data,” Dr Zhao says. “Using historical and modern cases makes learning a technical subject a lot of fun.”

(The book has been published by Post & Telecom Press)
The book has been years in the making. The first draft was finished in 2011 and then important theoretical developments in the field between then and now were added .
R language experts Yihui Xie and Xiangyun Huang co-authored the book, which was recently published last month by Post & Telecom Press.
“We want more people to know how to use graphics to show data and how to use software tools to make those graphics,” Dr Zhao says.
By Luyao Wang
Photo by Luyao Wang
Translated by Huan Zhu
Edited by Huan Zhu, Xinmin Han and Tamara Kaup
20 Sep 2021
RELATED NEWS

XJTLU adds Social Sciences to its ESI Top 1% fields
This month, Xi'an Jiaotong-Liverpool University entered Clarivate’s Essential Science Indicators Top 1% list of institutions in the field of Social Science, ...
Learn more
XJTLU climbs in science rankings
According to the latest Times Higher Education (THE) subject rankings for physical sciences, Xi’an Jiaotong-Liverpool University has joined the 401-500 band....
Learn more